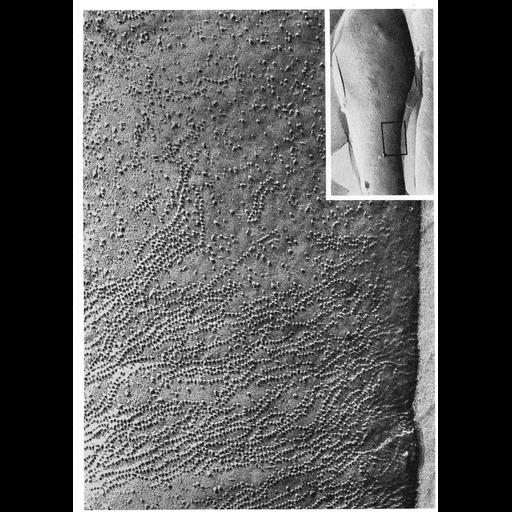
This electron micrograph shows the P-face of a small region of membrane from the midpiece of guinea pig sperm. The changing distribution of intramembranous particles (IMPs)in this image provided some of the first evidence of local variation in the organization of the membrane. Linear arrays of IMPs in the lower region of the micrograph are closely associated with mitochondria. This image first appeared in Fawcett, International Cell Biology 1976-7, p 588-600, Rockefeller University Press, New York, and was reprinted with permission as Figure 6 from Chapter 1 (The Cell Surface) of 'The Cell, 2nd Ed.' by Don W. Fawcett M.D. A PDF copy of the accompanying chapter is available on the ASCB's BioEDUCATE website.
With the freeze-fracture technique, tissue is rapidly frozen and cracked to shear along zones of weakness. Cleavage of membranes occurs along the hydrophobic interior of the lipid bilayer to reveal views of a "p-face" (the outwardly-facing inner half of the membrane) and an "e-face" (the inwardly-facing outer half of the membrane), and a metallic replica is made of the fractured surface. The intramembranous particles represent integral membrane proteins.
| Spatial Axis | Image Size | Pixel Size |
|---|---|---|
| X | 922px | —— |
| Y | 1292px | —— |