Alternate header for print version


Licensing
Attribution Non-Commercial; No Derivatives:This image is licensed under a Creative Commons Attribution, Non-Commercial, No Derivatives License. View License Deed | View Legal Code
tweet  
*CIL – Cell Image Library accession number. Please use this to reference an image.

CIL:11043*  Cite 
Description

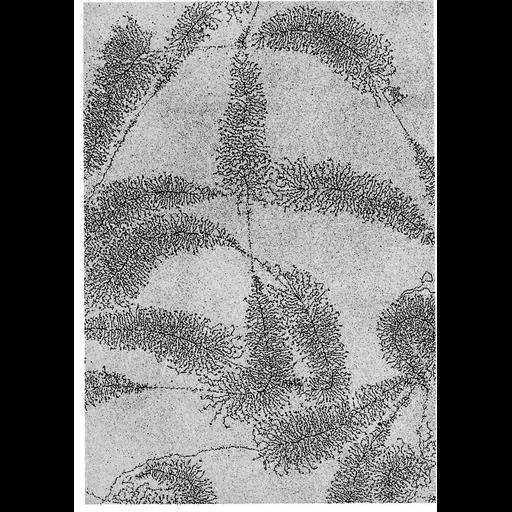
Transmission electron micrograph of transcription of tandemly arranged ribosomal RNA genes. Amphibian oocyte nuclei contain numerous extra-chromosomal nucleoli, each of which contains a tandem array of genes encoding ribosomal RNA. Here, using the methods developed by O.L. Miller Jr. and colleagues, the extrachromosomal nucleoli from a newt oocyte have been dispersed in low salt, and centrifuged through a sucrose cushion containing formaldehyde on to a carbon coated grid and stained for TEM imaging. Active transcription is seen by the tree-like structures in which each branch represents a growing transcript. Untranscribed spacer DNA is seen between each transcript.

Technical Details

Micrograph originally published in Miller & Beatty, Science 164:955-957, and reprinted with permission as Figure 144 from Chapter 4 (Nucleus) of 'The Cell, 2nd Ed.' by Don W. Fawcett M.D. A PDF copy of the accompanying chapter is available on the ASCB's BioEDUCATE website.

Biological Sources
NCBI Organism Classification
Notophthalmus viridescens
Cell Type
oocyte
Cellular Component
nucleolar chromatin
chromatin
ribosomal RNA
Biological Context
Biological Process
nucleus organization
RNA metabolic process
Molecular Function
rRNA transcription
Attribution
Names
Oscar L. Miller
Don W Fawcett
Published
ISBN 0721635849
Published
from: Don W. Fawcett M.D ‘The Cell’ 2nd edition, W.B. Saunders Chapter 4 (Nucleus)
Pubmed
5813982
Link
Fawcett's "The Cell, 2nd Ed."
Science Magazine
OTHER
B. R. Beatty
Citation
Digital Object Identifier (DOI)
doi:10.7295/W9CIL11043
Archival Resource Key (ARK)
ark:/b7295/w9cil11043
Imaging
Image Type
film
Image Mode
transmission electron microscopy (TEM)
detection of electrons
Parameters Imaged
electron density
Source of Contrast
differences in adsorption or binding of stain
Visualization Methods
uranyl salt
Processing History
Image extracted from .pdf file of 'The Cell'
Data Qualifiers
processed data
Sample Preparation
Methods
formaldehyde fixed tissue
Relation To Intact Cell
isolated subcellular component
Dimensions
Spatial Axis Image Size Pixel Size
X 920px ——
Y 1296px ——