Alternate header for print version


Licensing
Attribution Non-Commercial; No Derivatives:This image is licensed under a Creative Commons Attribution, Non-Commercial, No Derivatives License. View License Deed | View Legal Code
tweet  
*CIL – Cell Image Library accession number. Please use this to reference an image.

CIL:11829*  Cite 
Description

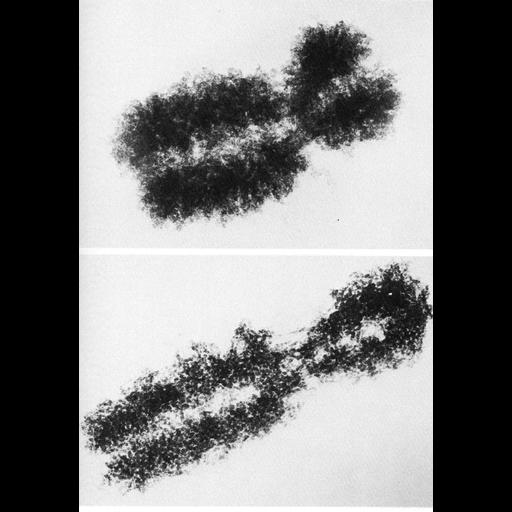
Transmission electron micrographs of whole metaphase chromosomes isolated from Chinese Hamster Ovary (CHO) cells showing the characteristic paired chromatids and centromeric constrictions.

Technical Details

The upper image shows a metaphase chromosome after mitotic cells were swollen in 0.075M KCl, fixed in 3:1 methanol:acetic acid, squashed in 50% acetic acid, stained with uranyl acetate and observed using transmission electron microscopy. The chromosomes consist of loops of ~30nm diameter chromatin fibers. The lower image shows chromosomes also isolated from CHO cells using the non-aqueous method of Wray and Stubblefield in the presence of calcium. Under these conditions, chromatin loops are ~50 nm in diameter. These images were published as Figures 128 (upper, from H. Ris, Electron Microscopy, 1956) and 129 (lower, reprinted with permission by Academic Press, from H. Ris and J. Korenberg in Cell Biology, V2, Goldstein and Prescott, eds.) from Chapter 4 (Nucleus) of 'The Cell, 2nd Ed.' by Don W. Fawcett M.D. A PDF copy of the accompanying chapter is available on the ASCB's BioEDUCATE website.

Biological Sources
NCBI Organism Classification
Cricetulus griseus
Cell Line
CHO
Cellular Component
nuclear chromosome
condensed nuclear chromosome, centromeric region
Attribution
Names
Hans Ris
J. Korenberg
Don W Fawcett
Published
ISBN 0721635849
Published
from: Don W. Fawcett M.D ‘The Cell’ 2nd edition, W.B. Saunders Chapter 4 (Nucleus)
Link
ASCB BioEDUCATE Program
Citation
Digital Object Identifier (DOI)
doi:10.7295/W9CIL11829
Archival Resource Key (ARK)
ark:/b7295/w9cil11829
Grouping This image is part of a group.
Imaging
Image Type
film
Image Mode
transmission electron microscopy (TEM)
detection of electrons
Parameters Imaged
electron density
Source of Contrast
differences in adsorption or binding of stain
Visualization Methods
uranyl salt
Processing History
Image extracted from .pdf file of 'The Cell'
Data Qualifiers
processed data
Sample Preparation
Methods
chromosome squash
Relation To Intact Cell
isolated subcellular component
Dimensions
Spatial Axis Image Size Pixel Size
X 868px ——
Y 1255px ——