Alternate header for print version


Licensing
Attribution Non-Commercial Share Alike:This image is licensed under a Creative Commons Attribution, Non-Commercial Share Alike License. View License Deed | View Legal Code
tweet  
*CIL – Cell Image Library accession number. Please use this to reference an image.

CIL:13476*  Cite 
Description

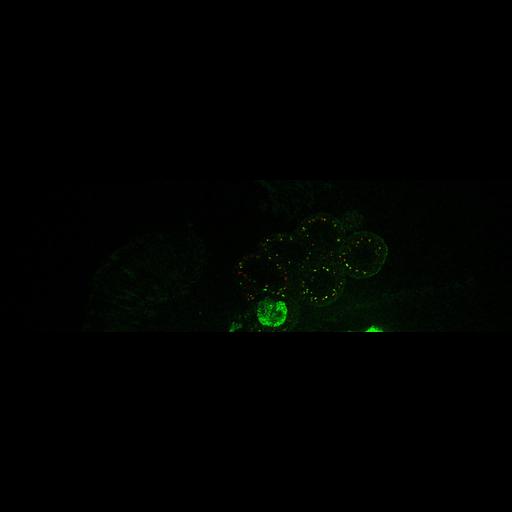
Ema localizes to endosomes. Third instar larval garland cells expressing Ema-GFP fusion protein with endosomes labeled with a 5-min pulse of the fluid-phase endocytic tracer avidin-Cy3 followed by an additional 5-min chase. Ema localizes to functional endosomes. Third instar larvae were dissected in ice-cold PBS, equilibrated in the Schneider medium for 5 min at room temperature, pulsed with 10 µg/ml of Extravidin-Cy3 (Sigma-Aldrich) at room temperature for 5 min, rinsed thoroughly, and chased in Schneider medium. Samples were fixed in 4% PFA in PBS for 10 min at room temperature. Confocal images were acquired with a confocal microscope (model C1; Nikon) and accompanying EZ-C1 software using argon (excitation at 488 nm) and HeNe (excitation at 543 and 633 nm) lasers and a 60x Plan-Apochromat NA 1.4 objective (Nikon) at room temperature. Samples for each experiment were processed using the same confocal gain setting. Image corresponds to Fig 3A in Kim et al. J Cell Biol. 188: 717-734. 2010.

Biological Sources
NCBI Organism Classification
Drosophila melanogaster
Cell Type
garland cell
Cellular Component
endosome
Biological Context
Biological Process
endocytosis
Attribution
Names
Sungsu Kim
Yogesh P. Wairkar
Richard W. Daniels
Aaron DiAntonio
Published
J Cell Biol. 188: 717-734. 2010
Pubmed
PMID: 20194640
Link
http://jcb-dataviewer.rupress.org/jcb/browse/...
Citation
Digital Object Identifier (DOI)
doi:10.7295/W9CIL13476
Archival Resource Key (ARK)
ark:/b7295/w9cil13476
Grouping This image is part of a group.
Imaging
Image Type
recorded image
photomultiplier tube (PMT)
Image Mode
fluorescence microscopy
confocal microscopy
Parameters Imaged
fluorescence emission
Source of Contrast
distribution of a specific protein
compartmentalization of stain or label
Visualization Methods
EGFP
Cy3
Data Qualifiers
raw, unprocessed data
Sample Preparation
Methods
formaldehyde fixed tissue
Relation To Intact Cell
whole mounted tissue
Dimensions
Spatial Axis Image Size Pixel Size
X 2048px ——
Y 608px ——