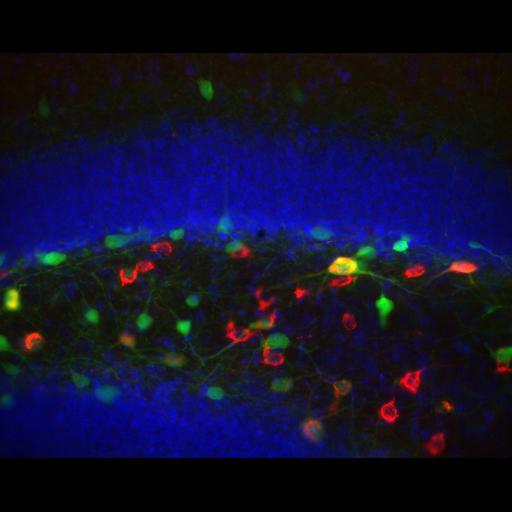
Distribution of interneurons expressing EGFP from the 5HT3 receptor promoter (Tg(Htr3a-EGFP)DH30Gsat, www.gensat.org) colabelled for somatostatin (red) and counterstained with DAPI (blue) to show the granule cell layer. EGFP-expression was amplified with chicken anti-GFP (Abcam, 1:2000). EGFP positive cells bodies and fibers are present throughout all layers of the hippocampus but enriched in the hilus (see associated images). Somatostatin expression is detected in a significant proportion of the EGFP-expressing interneurons in the hilus. Somatostatin immunoreactivity (Zymed rabbit polyclonal, 1:50) in the dentate gyrus identifies Hippocampal Interneurons of the Perforant Path (HIPP cells). HIPP cells project to the outer molecular layer of the dentate gyrus but also give rise to an axonal plexus within the hilus. See Tallent (2007) for more information on HIPP cells, Pubmed ID 17765724. Section (40 um) was mounted with Fluoromount G and imaged with a 32X, 0.4 NA Achroplan objective on a Zeiss Axiovert microscope. AF568 was excited at 562/40 nm and emission collected at 624/40 nm with Semrock filters and a single band dichroic (530-585 nm reflected, 601-800 nm transmitted). AF488 was excited at 482/35 nm and emission collected at 536/40 nm with Semrock filters and a single band dichroic (446-499 nm reflected, 513-735 nm transmitted). DAPI was excited at 350/50 nm and emission collected at 460/50 nm with a CLP400 dichroic (Chroma). Single images were captured for each channel using a Zeiss Axiocam MR CCD and pseudo-colored using Axiovision. Background (linear) was subtracted from the image using Axiovision for presentation. See Davis and Puhl (2011), Pubmed ID 21305052, for a detailed staining protocol. This image is part of a series characterizing EGFP expression from the 5HT3 promoter throughout the brain.
| Spatial Axis | Image Size | Pixel Size |
|---|---|---|
| X | 1300px | 0.3518µm |
| Y | 1030px | 0.3518µm |
| Z | 1030px | 0.3518µm |