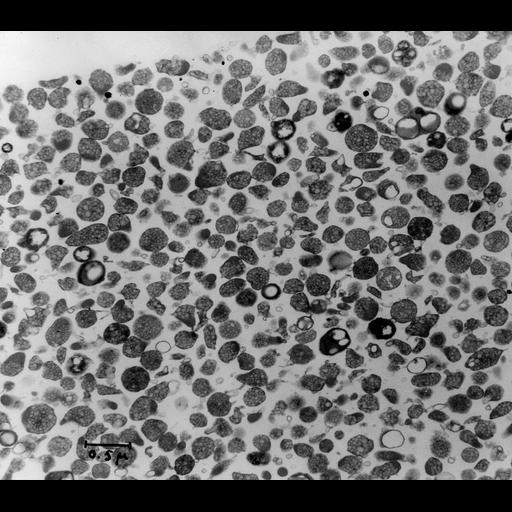
Transmission electron micrograph of a cell fractionation of golgi bottom fraction. Image made available by James D. Jamieson and the Department of Cell Biology, Yale University School of Medicine.
The authors took advantage of the fact that rats gavage-fed a large bolus of ethanol were observed to have their Golgi cisternae loaded with LDL particles. Since LDL partlcles are lighter than most other intracellular organelles, following homognenization of ethanol-fed rats, the Golgi fractions "floated" to the top of denser sucrose gradients during centrifugation. This allowed investigators to analyze the membrane properties of "pure" Golgi fractions and set the stage for development of fusion assays that led to an understanding of factors regulating the specificity of membrane fusion - the SNARE hypothesis. An additional technical reference is Ehrenreich et al 1973 JCB 59:45-72. Original 3.25 in. x 4 in. lantern slides were scanned at 600dpi. Original Magnification: x13,750.
| Spatial Axis | Image Size | Pixel Size |
|---|---|---|
| X | 6000px | —— |
| Y | 5265px | —— |