Alternate header for print version


Licensing
Attribution Non-Commercial Share Alike:This image is licensed under a Creative Commons Attribution, Non-Commercial Share Alike License. View License Deed | View Legal Code
tweet  
*CIL – Cell Image Library accession number. Please use this to reference an image.

CIL:39080*  Cite 
Description

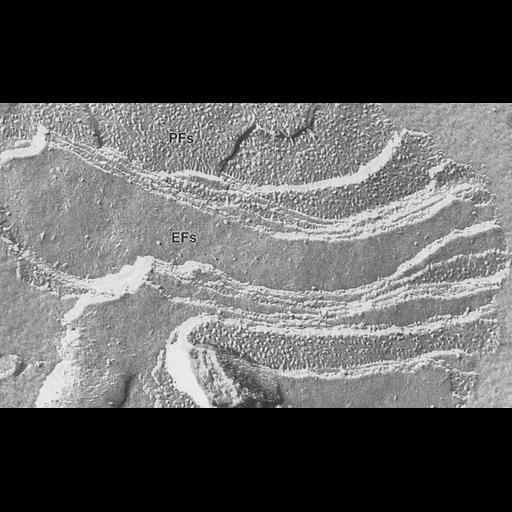
CD3 mutant wheat (deficient in chlorophyll b) was germinated and grown for 6 days in the dark, greened at high light intensity in the presence of chloramphenicol for 4 days, thylakoids prepared, plunge-frozen, and freeze-fracture replicas obtained and examined by transmission electron microscopy. This region shows the characteristic particle size and distribution found on the EFs and PFs membrane faces of stacked thylakoid membranes. This set of grouped images, which also shows thin sections, includes images of wild-type wheat.

Technical Details

Thylakoid preparations were equilibrated with 35% glycerol, plunge frozen in liquid Freon 12 cooled in liquid N2 and fractured and replicated in a Balzers BA 360 freeze etch device. Replicas were examined in a JEOL 100C at 80KV and images recorded on film. See Fig 13 in K D Allen et al. 1988 Biogenesis of thylakoid membranes is controlled by light intensity in the conditional chlorophyll b-deficient CD3 mutant of wheat. J Cell Biol 107:907-919.

Biological Sources
NCBI Organism Classification
Triticum sp.
Cell Type
leaf
Cellular Component
chloroplast
plastid thylakoid membrane
Biological Context
Biological Process
photosynthesis
organelle organization
Attribution
Names
K D Allen
M E Duysen
L A Staehelin
Published
K D Allen, ME Duysen, and LA Stahelin 1988 Biogenesis of thylakoid membranes is controlled by light intensity in the conditional chlorophyll b-deficient CD3 mutant of wheat. J Cell Biol 107:907-919
Pubmed
3047153
Link
Journal of Cell Biology
Citation
Digital Object Identifier (DOI)
doi:10.7295/W9CIL39080
Archival Resource Key (ARK)
ark:/b7295/w9cil39080
Grouping This image is part of a group.
Imaging
Image Type
film
Image Mode
transmission electron microscopy (TEM)
Parameters Imaged
electron density
Source of Contrast
differences in deposition of metal shadow
Visualization Methods
shadowing and plating
Data Qualifiers
processed data
Sample Preparation
Methods
freeze_fracture/freeze_etch
Relation To Intact Cell
isolated subcellular component
Dimensions
Spatial Axis Image Size Pixel Size
X 1788px ——
Y 1068px ——