Alternate header for print version


Licensing
Attribution Non-Commercial Share Alike:This image is licensed under a Creative Commons Attribution, Non-Commercial Share Alike License. View License Deed | View Legal Code
tweet  
*CIL – Cell Image Library accession number. Please use this to reference an image.

CIL:39734*  Cite 
Description

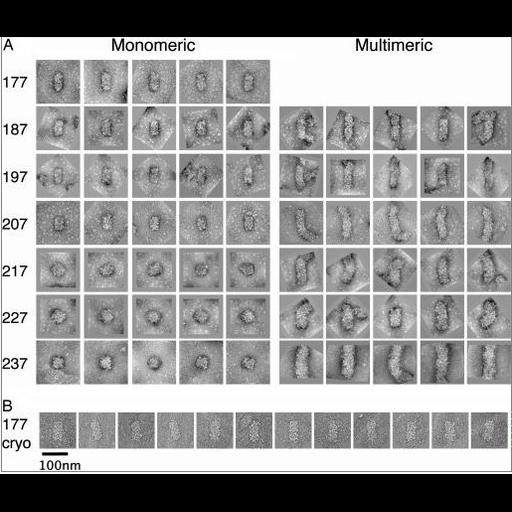
EM images of chromatin fibers reconstituted from tandem arrays of a strong nucleosome positioning sequence flanked by different lengths of 'linker' DNA, to create nucleosome repeat lengths (NRL) from 177 bp to 237 bp. Reconstitutes had saturating amounts of purified core histones and linker histones. (A) shows the range of structures seen with glutaraldehyde fixation and negative staining, with the left panel illustrating individual fibers and the right panel longer structures consisting of end-to-end aggregates.(B)shows images of a single NRL after cryo-fixation and recorded in the frozen hydrated state. See Fig 1 in P.J. Robinson et al. 2006. EM measurements define the dimensions of the "30-nm" chromatin fiber: Evidence for a compact, interdigitated structure. Proc Natl Acad Sci USA 103:6506-6511.

Technical Details

See: P.J. Robinson et al. 2006. EM measurements define the dimensions of the "30-nm" chromatin fiber: Evidence for a compact, interdigitated structure. Proc Natl Acad Sci USA 103:6506-6511.

Biological Sources
Cellular Component
chromatin
Biological Context
Biological Process
chromatin organization
DNA organization
Attribution
Names
Philip J Robinson
Louise Fairall
Van A Huynh
Daniela Rhodes
Published
P.J. Robinson et al. 2006. EM measurements define the dimensions of the "30-nm" chromatin fiber: Evidence for a compact, interdigitated structure Proc Natl Acad Sci USA 103:6506-6511.
Pubmed
16617109
Link
Proceedings National Academy of sciences USA
Citation
Digital Object Identifier (DOI)
doi:10.7295/W9CIL39734
Archival Resource Key (ARK)
ark:/b7295/w9cil39734
Grouping This image is part of a group.
Imaging
Image Type
recorded image
Image Mode
transmission electron microscopy (TEM)
Parameters Imaged
electron density
Source of Contrast
differences in adsorption or binding of stain
intrinsic mass distribution
Visualization Methods
visualization of contiguous regions
negative staining
uranyl salt
Processing History
montage
Data Qualifiers
processed data
Sample Preparation
Methods
glutaraldehyde fixed tissue
cryofixed tissue
Relation To Intact Cell
isolated subcellular component
Dimensions
Spatial Axis Image Size Pixel Size
X 515px ——
Y 440px ——