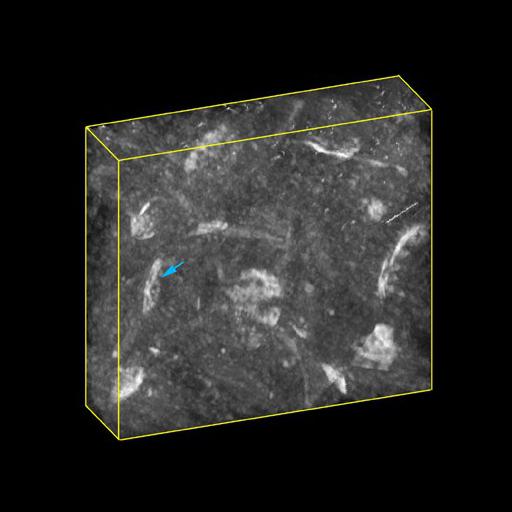
Postsynaptic densities (PSDs) in the CA1 region of the rat hippocampus, revealed by ethanolic phosphotungstic acid (EPTA) staining, were reconstructed from a maximum intensity projection of tomographic reconstruction (see, for example the blue arrow). Intensity was reversed so that PSDs appear bright against a dark background. This image has been downsampled from the raw data image which can be accessed using the link provided to the Cell Centered Database. For more information see: Martone M. E.; Jones Y. Z.; Young S. J. Ellisman; M. H. Zivin; J. A. and Hu B. R. (1999) Modification of postsynaptic densities following transient cerebral ischemia:a quantitative and three dimensional ultrastructural study. J. Neurosci.19:1988-97.
Electron microscopic methods: Tissue sections from were stained either by 1% ethanolic phosphotungstic acid (E-PTA) (Bloom and Aghajanian, 1966, 1968) or by the conventional osmium-uranium-lead method. Briefly, coronal brain sections were cut at a thickness of 200 um with a Vibratome through the level of the dorsal hippocampus and post-fixed for 1 hr with 4% glutaraldehyde in 0.1 M cacodylate buffer, pH 7.4. For conventional osmium-uranium-lead staining, sections were post-fixed for 2 hr in 1% osmium tetroxide in 0.1 M cacodylate buffer, rinsed in distilled water, and stained with 1% aqueous uranyl acetate overnight. The tissue sections were then dehydrated in an ascending series of ethanol to 100%, followed by dry acetone, and embedded in Durupan ACM. Thin sections were counterstained with lead citrate before examination in the electron microscope. For E-PTA staining, sections were dehydrated in an ascending series of ethanol to 100% and stained for 1 hr with 1% PTA prepared by dissolving 0.1 gm of PTA in 10 ml of 100% ethanol and adding four drops of 95% ethanol. Sections were then embedded in Durcupan ACM. The tomogram was generated from single tilt images that spanned -60 to 60° in 2° increments, acquired with a using an JEOL4000 IVEM. Magnification, 20000.0 X; accelerating voltage, 400 KeV.
| Spatial Axis | Image Size | Pixel Size |
|---|---|---|
| X | 492px | —— |
| Y | 492px | —— |