A novel cell population analysis to quantify both initial and long-term drug effects, namely pseudopod adaptation and recovery following an initial drug-induced perturbation, adding a full therapeutic dose at once at t=0.
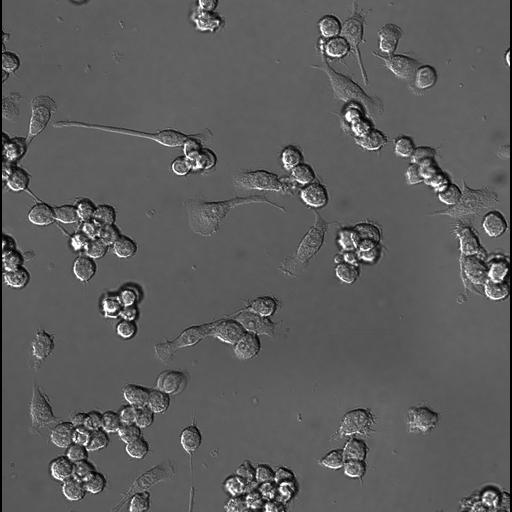
populations of ~1200 cells plated on glass in standard media were imaged at 37º C in each experiment. A target subpopulation of ~100 cells display a readily observed extended, ruffling leading edge pseudopod . The cells exhibiting these deployed, extended pseudopods were counted in each unit area at 6 timepoints during the 3 hr observation period following rapid addition of drug to its standard working concentration. Altogether, 6 experiments were carried out for each treatment, yielding average timecourses summarizing observations of ~600 polarized cells.
Images are provided as uncorrected, 16 bit .nd2 files to preserve all original data. To view these .nd2 files:
1. Download ImageJ viewer at (https://imagej.nih.gov/ij/download.html)
2. Download the BioFormats.jar package at (https://www.openmicroscopy.org/bio-formats/downloads/)
3. Open the ImageJ directory after installation and drag the extracted BioFormats.jar package into the "Plugins" subdirectory
4. Open an .nd2 image using imageJ and select opening options when prompted, if desired. If no modifications are desired, select "OK"
5. The 16 bit image will typically look dark and will require brightness adjustment.
6. In the ImageJ toolbar, select Image >> Adjust >> Brightness/Contrast and select "Auto", or manually set the brightness and contrast.