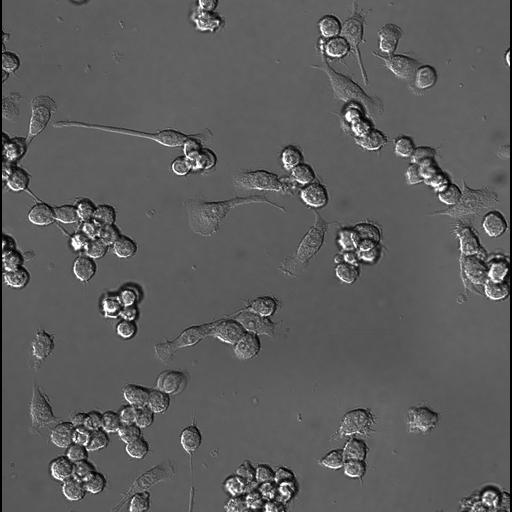
A novel cell population analysis to quantify both initial and long-term drug effects, namely pseudopod adaptation and recovery following an initial drug-induced perturbation, adding drug slowly in 1/4 increments over 90 minutes.
~1200 cells were imaged on glass. More gradual additions of drug or carrier were carried out in four equal increments at 0, 30, 60, 90 min, together yielding the same final drug concentration indicated in rapid addition studies. The subpopulation of ~100 cells with extended, leading edge pseudopods at t = 0 were imaged and counted in each unit area at the indicated timepoints during a 125 min observation period T=37C
Images are provided as uncorrected, 16 bit .nd2 files to preserve all original data. To view these .nd2 files:
1. Download ImageJ viewer at (https://imagej.nih.gov/ij/download.html)
2. Download the BioFormats.jar package at (https://www.openmicroscopy.org/bio-formats/downloads/)
3. Open the ImageJ directory after installation and drag the extracted BioFormats.jar package into the "Plugins" subdirectory
4. Open an .nd2 image using imageJ and select opening options when prompted, if desired. If no modifications are desired, select "OK"
5. The 16 bit image will typically look dark and will require brightness adjustment.
6. In the ImageJ toolbar, select Image >> Adjust >> Brightness/Contrast and select "Auto", or manually set the brightness and contrast.