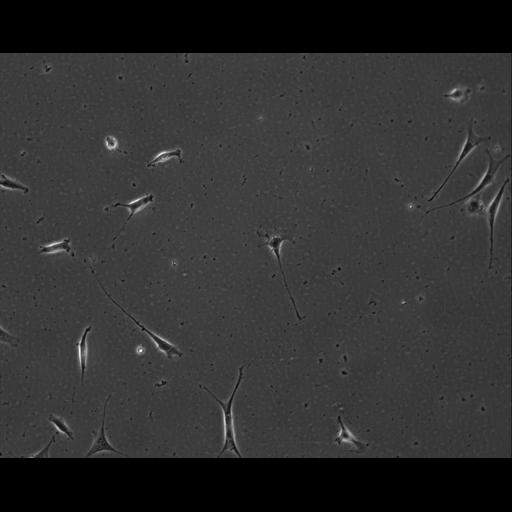
This is part of a triplicate data set of non-overlapping fields of NIH 3T3 fibroblasts cultured on polystyrene. Each set is indicated by the well number. Each image contains 4 images of each field as a time series. The first image is the phase contrast image. The second image channel is Tenascin-C promoter driven destabilized EGFP reporter vector. The third image is Texas Red C2-maleimide (to stain cell body), and the fourth image is Dapi (to stain nuclei). Images were collected on a Zeiss Axiovert 100. The samples were viewed with a Zeiss A-plan 10x Ph1 0.25 NA objective and recorded with a CoolSnapFX camera using 2 x 2 binning. The filters were as follows: 1.) A custom dichroic multipass beam splitter optimized for imaging DAPI, EGFP and TxRed (part# BS51019+400dclp, Chroma Technology, VT); 2.) DAPI excitation filter-360/40 nm; 3.) DAPI emission filter-460/50 nm; 4.) EGFP excitation filter-470/40 nm; 5.) EGFP emission filter-525/50 nm; 6.) TxRed excitation filter-568/24 nm; 7.) TxRed emission filter-630/60 nm. Autofocus on the TxRed color channel was performed at each location before the series of images were collected. Protocol: The cells were seeded on TCPS dishes at ~1000 cells/well during a passage cycle. The test cultures were incubated overnight before being rinsed with PBS and then fixed with 300 uM m-maleimidobenzoyl-N-hydroxysuccinimidyl ester (MBS) in microtubule stabilizing buffer (MTSB) composed of 4% (w/v) polyethylene glycol (PEG) 8000, 100 mM 1,4-piperazinediethanesulfonic acid (PIPES),10 mM ethylene glycol-bis(2-aminoethylether)-N,N,N’,N’-tetraacetic acid (EGTA), pH 6.9 for at least 16h at RT. The fixative was removed and solution of 0.05% Triton X100 in PBS containing 10 ng/mL of Tx Red C2-maleimide and 2 ng/mL DAPI for 2h. The staining solution was removed, cells were rinsed with PBS/3% BSA, and 0.05% sodium azide and PBS. A 50% glycerol/10 mM Tris, pH 8.0 containing 2ng/mL DAPI and 0.9g/l 1,4-diazobicyclo[2,2,2]octane (DABCO) as an antifade reagent was then added to each well for imaging purposes. The bottom of the wells were wiped with 70% ethanol wipe and then a dry wipe before imaging. Purpose: The purpose of the dataset was to measure the distribution of EGFP fluorescence intensities within individual cells in the population. Using the image sets collected, a plugin for ImageJ was used to perform the following image analysis tasks. 1.) The Txred images (which is a general purpose cell body stain) were segmented by manual thresholding. 2.) The resulting mask was used to define cell ROIs on the DAPI and EGFP images. 3.) The number of nuclei in each ROI is determined from the DAPI image and the integrated intensity of the EGFP signal in the cell is determined from ROI in the EGFP image. 4.) A local background intensity around each cell in the EGFP image is determined by dilating the ROI by 3 pixels and determining the pixel intensities in only the 3 pixel dilation area. When this data is placed in a spread sheet, you can use the results to identify cell clusters (i.e. have more than 1 nuclei), debris or partial cell (i.e. no nuclei), poor EGFP/cell measurements (i.e. high background intensity). The spreadsheet can be used to measure the distribution of EGFP cell intensities within a population of cells. The phase images were collected as quality control and validation data. The phase images provide a human validation mechanism if there are questions about the staining and/or fluorescence detection in an image. References: 1. Langenbach, K.J., Elliott, J.T., Tona, A., and Plant, A.L. (2006) Evaluating the correlation between fibroblast morphology and promoter activity on thin films of extracellular matrix proteins. BMC-Biotechnology 6(1):14. 2.Elliott, J.T., Halter, M., Woodward, J.T., Langenbach, K.J., Tona, A., Plant, A.L. (2008) Evaluating the performance of fibrillar collagen films formed at polystyrene surfaces as cell culture substrates. Biointerphases. 3(2):19-28.
| Spatial Axis | Image Size | Pixel Size |
|---|---|---|
| X | 650px | 1.34µm |
| Y | 515px | 1.34µm |