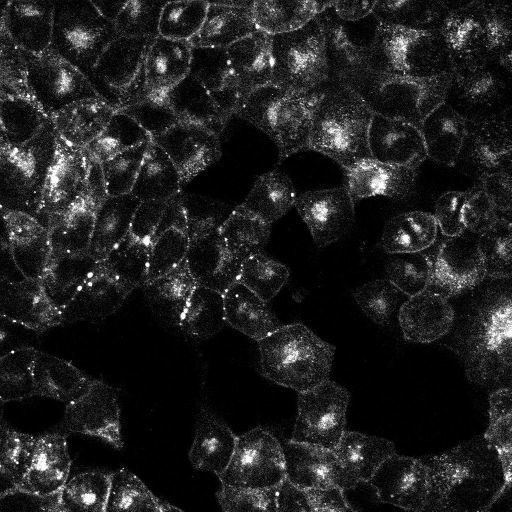
Maximum intensity projection of a confocal z series of MDCK cells expressing Cx43-GFP-4C imaged with confocal microscopy
Full resolution image description
Full resolution time series with each time point representing a maximum intensity projection through the z series collected at 6 minute intervals in IMOD MRC format.
File format
MRC
Animation description
Annotated time lapse animation of synchronized populations of MDCK cells expressing Cx43-GFP-4C imaged with confocal microscopy, revealing the dynamic redistribution of Cx43 during mitosis. Images were recorded every 6 min for a total duration of 4 h and 23 min. At each time point, 3D volume reconstructions from confocal image stacks over time are displayed (two frames per minute). The full resolution data are available for download.
Maximum intensity projection of a z series collected at a single time point of MDCK cells transfected with GFP-CX43
Full resolution image description
File containing original confocal imaging stack in Olympus Fluoview .oif format. An optical section series consisting of 21 optical sections was obtained at each of 41 time points (6 min intervals).
Animation description
Annotated time lapse animation of synchronized populations of MDCK cells expressing Cx43-GFP-4C imaged with confocal microscopy, revealing the dynamic redistribution of Cx43 during mitosis. Images were recorded every 6 min for a total duration of 4 h and 23 min. At each time point, 3D volume reconstructions from confocal image stacks over time are displayed (two frames per minute). The full resolution data are available for download.
The fate of Connexin43 gap junction protein during mitosis
Description
During the cell cycle, gap junction communication, morphology and distribution of connexin43 (Cx43)-containing structures change dramatically. As cells round up in mitosis, the majority of Cx43 labeling is intracellular and intercellular coupling is reduced. We are interested in investigating Cx43 distributions during mitosis in exogenous expressing cells using in vivo time-lapse imaging.
Funding agency
NIH GM072881 and GM065937 awarded to Gina Sosinky, NIH GM55632 awarded to Paul Lampe
Leader(s)
Daniela Boassa
Collaborator(s)
Gina Sosinky
Paul Lampe and Joell Solan
Start date
unspecified
End date
unspecified
Experiment
Experiment ID
7760
Title
Live cell imaging of rCx43-GFP-4C stable cell line
Purpose
Investigate trafficking and re-distribution of Cx43 GFP during cell division
Experimenter(s)
Daniela Boassa
Microscopy product
Microscopy product ID
7769
Instrument
Olympus Fluoview 1000
Microscopy type
LASER SCANNING CONFOCAL
Product type
TIME SERIES
Image basename
Supplemental movie1
Spatial Axis
Image Size
Pixel Size
X
1024px
0.21 um/pixels
Y
1024px
0.21 um/pixels
Y
21px
Subject
Species
Dog
Scientific name
Canis familiaris
Strain
NA
Group by
NA
Treatment
In order to image several cells progressing through mitosis, we synchronized cells using a combination of serum starvation and application of aphidicolin, an inhibitor of DNA synthesis, to create an enriched population of cells undergoing mitosis suitable for imaging.
Specifically, confluent cells were trypsinized and grown for about 20 hours in the presence of minimal serum and aphidicolin, resulting in a G1/S block. The drug was then washed out, normal serum was restored and cells were allowed to progress through S phase to mitosis. After 7 hrs, when cells begin entering mitosis, time-lapse imaging of the intrinsic GFP fluorescence was performed.
Age class
NA
Tissue section
Anatomical location
NA
Tissue product storage
NA
Specimen description
Organ
kidney
Structure
gap junction
Cell type
MDCK cell
Imaging parameters
Type
Light microscopy product
Immersion medium
oil
Mounting medium
Opti-MEM
Lens
Olympus PlanApo 60X oil
Lens magnification
X
Numerical aperture
1.42
Notes
Live cell imaging was conducted on an Olympus FluoView1000
confocal microscope equipped with a temperature-controlled chamber
(at 37¿C). Medium: Opti-MEM supplemented with 5% FBS covered with a glass coverslip.
Specimen preparation
Protocol used
Madin-Darby canine kidney (MDCK) cells were maintained at 37degrees C, and 10% CO2 in Dulbecco's modified Eagle's medium containing 10% fetal bovine serum (FBS) (Gibco-BRL, Invitrogen). Transductions were carried out using a retroviral system according to the protocols from the Nolan laboratory (www.stanford.edu/group/nolan). Experiments were conducted on endogenous expressing or stably Cx43-expressing cell lines generated by transduction followed by selection with the antibiotic hygromycin (Gibco-BRL, Invitrogen). In order to image several cells progressing through mitosis, cells were synchronized using a combination of serum starvation and application of aphidicolin (APD), an inhibitor of DNA synthesis, to create an enriched population of cells undergoing mitosis. Confluent cells were trypsinized and grown for about 20 h in the presence of minimal serum and APD, resulting in a G1/S block. The drug was then washed out, normal serum was restored and the cells were allowed to progress through S phase to mitosis.Time-lapse imaging of the intrinsic GFP was performed after 7 h, when cells began entering mitosis.
Imaging product type
Type
Optical section
Description
At each time point, a z series of 21 optical sections was generated.
Z resolution
0.5 um
Citation Information
Daniela Boassa, Gina Sosinky, Paul Lampe and Joell Solan CCDB:7769, Canis familiaris, gap junction, MDCK cell. CIL. Dataset. https://doi.org/doi:10.7295/W9CCDB7769